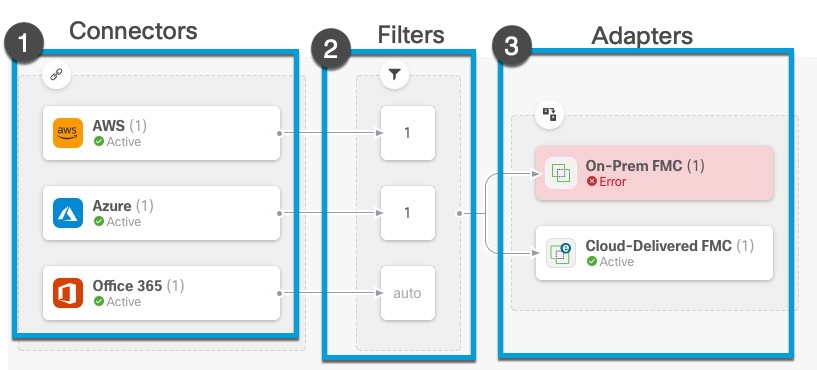
Dashboard of a configured system
Sample dynamic attributes connector Dashboard page of a configured system:
Click an area in the figure to learn more about it or click one of the links following the figure.

The Dashboard shows the following (from left to right):
|
Connectors column |
Filters column |
Adapters column |
|---|---|---|
|
List of connectors with a number indicating how many of each type are configured. Connectors collect dynamic attributes that could be sent to the configured adapter. Dynamic attributes filters specify what data is sent. Click |
List of dynamic attributes filters associated with each connector with a number indicating how many of each filter are associated with a connector. Click |
List of adapters. Adapters receive dynamic objects from configured connectors using configured dynamic attributes filters; these dynamic objects can be used in access control policies without the need to deploy them. Click |
Note | Some connectors, such as Outlook 365 and Azure Service tags, automatically pull available dynamic objects without the need for a dynamic attributes filters. Those connectors display Auto in the |
The Dashboard indicates whether or not an object is available. The Dashboard page is refreshed every 15 seconds but you can click Refresh (![]() ) at the top of the page at any time to refresh immediately. If issues persist, check your network connection.
) at the top of the page at any time to refresh immediately. If issues persist, check your network connection.
Related Topics: